🔥 (Heart Pumping Cycle — Core Concepts)
1. Electrical activation → Mechanical contraction (KEY LINK!)
- The heart pumps only because electrical depolarization triggers contraction.
- Depolarization → contraction begins
- This electrical-mechanical coupling is the basis of all cardiac cycle questions.
Repolarization → contraction ends ~50 ms later
2. What ECG waves actually mean for pumping
- P wave → Atria depolarize → Atrial systole begins
- R wave peak → Ventricles depolarize → Ventricular systole begins
- T wave → Ventricles repolarize → Ventricular systole ends just after T
👉 Markers to memorize for exam diagrams:
- Atrial systole = just after P
- Ventricular systole = starts near end of R, ends just after T
3. What the cardiac cycle chapter really studies
- How pressures and volumes inside
✓ Atria
✓ Ventricles
✓ Aorta & pulmonary artery
change during systole and diastole to move blood correctly.
This is the whole chapter’s aim.
Every graph (Wiggers diagram!), number, and clinical concept ties back to this.
4. Systolic vs Diastolic PRESSURE — don’t confuse with systole/diastole
- Systolic pressure = highest arterial pressure during ventricular systole
- Diastolic pressure = lowest arterial pressure during ventricular diastole
👉 Students often confuse systolic pressure with “pressure during the entire systole.”
No — it’s just the peak.
5. One sentence that summarises the whole cardiac cycle
Orderly electrical activation creates orderly contraction, which produces orderly pressure changes that push blood from high-pressure chambers → low-pressure chambers.
If you understand this sentence, the rest of the chapter becomes easy.
🔥 Super-Short “Exam Memory Hooks”
- Electrical → mechanical (ECG controls contraction timing)
- P = atria contract
- R→T = ventricles contract
- T ends → relaxation begins
- Blood moves only because pressures change predictably
Cardiac cycle
🔥 1. LATE DIASTOLE — Passive filling (MOST IMPORTANT FILLING PHASE)
- AV valves open, semilunar valves closed.
- Blood flows passively from atria → ventricles.
- 70% of ventricular filling is passive.
- Ventricular pressure stays low.
Exam sentence:
Most of ventricular filling occurs before atrial contraction.
🔥 2. ATRIAL SYSTOLE — Final push ("atrial kick")
- Atria contract → push extra blood into ventricles (~20–30%).
- Slight backflow into veins can occur.
- Atrial contraction is especially important when heart rate is high or ventricles are stiff (LV hypertrophy, HFpEF).
Exam sentence:
Atrial systole increases ventricular filling and is lost in AF.
🔥 3. VENTRICULAR SYSTOLE — Contraction + Ejection
A. Isovolumetric contraction (0.05 s)
- AV valves close → S1.
- All valves closed → pressure rises fast.
- No volume change.
B. Ventricular ejection
- When LV pressure > aortic pressure: aortic valve opens.
- Rapid ejection → then slower.
- Peak LV pressure ~120 mmHg, RV ~25 mmHg.
Volumes to memorize:
- End-diastolic volume (EDV): 130 mL
- Stroke volume (SV): 70–90 mL
- End-systolic volume (ESV): 50 mL
- Ejection fraction (EF): ~65%
Exam sentence:
EF = (SV ÷ EDV). Best simple measure of LV function.
🩺 Integrated Clinical Scenario — Cardiac Cycle Applied at the Bedside
A 62-year-old man with long-standing hypertension presents with exertional dyspnea and palpitations. His pulse is irregularly irregular at 130 bpm, BP 150/90 mmHg. ECG shows atrial fibrillation. Echocardiography reveals left ventricular hypertrophy with preserved EF.
Let’s walk through one full cardiac cycle in this patient and connect every phase you listed, clinically and physiologically.
🔥 1. Late Diastole — Passive Ventricular Filling (Most Important Phase)
At the start of the cycle:
- AV valves (mitral & tricuspid) are open
- Semilunar valves are closed
- Blood flows passively from atria → ventricles
- This accounts for ~70% of ventricular filling
- Ventricular pressure remains low, because the ventricle is relaxing
👉 Clinical relevance here:
- Even in atrial fibrillation, this passive phase still occurs
- That’s why cardiac output doesn’t immediately collapse in AF
Exam linkage:
Most ventricular filling occurs before atrial contraction.
In this patient, despite AF, the ventricles still fill mostly via passive filling.
🔥 2. Atrial Systole — The “Atrial Kick” (Now LOST in This Patient)
Normally:
- Atria contract → add 20–30% extra blood to ventricular filling
- This is the atrial kick
- Slight backflow into veins may occur
- Becomes crucial when:
- Heart rate is high
- Ventricles are stiff (LVH, HFpEF)
👉 What happens in this patient?
- He has atrial fibrillation
- → No coordinated atrial contraction
- → Atrial systole is absent
- → Loss of 20–30% ventricular filling
👉 Why symptoms worsen here:
- His ventricle is hypertrophied and stiff
- He depends heavily on atrial kick
- Loss of atrial systole → ↓ preload → ↓ stroke volume
- This explains his dyspnea and exercise intolerance
Exam sentence fully applied:
Atrial systole increases ventricular filling and is lost in AF.
🔥 3. Ventricular Systole — Contraction and Ejection
A. Isovolumetric Contraction (≈ 0.05 s)
- Ventricles begin to contract
- AV valves close → S1
- All valves closed
- Pressure rises rapidly
- No change in volume
👉 Clinical tie-in:
- S1 is still present in AF
- Loud S1 may be heard if AV valves snap shut forcefully
B. Ventricular Ejection Phase
- When LV pressure exceeds aortic pressure
- Blood is ejected:
- Rapid ejection first
- Then reduced ejection
- Pressures achieved:
- LV ≈ 120 mmHg
- RV ≈ 25 mmHg
→ Aortic valve opens
👉 Volumes (apply directly):
- EDV ≈ 130 mL
- ESV ≈ 50 mL
- SV = 70–90 mL
- EF ≈ 65%
👉 In this patient:
- EF is preserved
- But EDV is reduced due to poor filling
- So stroke volume falls, even with normal EF
Critical exam concept:
EF = SV ÷ EDV — best simple measure of LV systolic function
This patient has HFpEF:
- EF normal
- Filling impaired
- Symptoms driven by diastolic dysfunction, not systolic failure
🔗 Final Integrated Clinical Logic (One Flow)
- Late diastole provides most filling → preserved
- Atrial systole normally adds critical preload → lost in AF
- Loss of atrial kick is disastrous in stiff ventricles
- Ventricular systole and EF may appear normal
- Yet cardiac output falls → symptoms
🧠 Single Examiner-Perfect Summary Line
In atrial fibrillation, loss of atrial systole reduces ventricular filling—particularly in patients with stiff ventricles—leading to reduced stroke volume despite preserved ejection fraction.

🔥 4. EARLY DIASTOLE — Relaxation + Opening of AV valves
A. Protodiastole
- Blood momentum decreases → semilunar valves close → S2.
B. Isovolumetric relaxation
- All valves closed again.
- Ventricular pressure falls rapidly.
C. AV valves open
- When ventricular pressure < atrial pressure → rapid filling begins.
Exam sentence:
Ventricular relaxation determines how quickly filling can occur → key in diastolic dysfunction.

🔥 5. TIMING DIFFERENCES BETWEEN RIGHT & LEFT HEART
- Right atrium contracts first.
- LV contracts before RV, but RV ejection begins earlier because pulmonary pressure is lower.
- Inspiration → physiological splitting of S2 (A2 before P2).
Exam sentence:
Pulmonary valve closure is delayed on inspiration → normal splitting of S2.
Elaborative Clinical Scenario — Timing Differences Between Right & Left Heart (Physiology → Bedside → Exam)
Clinical setting
A 22-year-old healthy male comes for a routine medical examination before joining a sports team. He has no symptoms—no chest pain, dyspnea, palpitations, or syncope. Vitals are normal. Blood pressure and oxygen saturation are normal.
During cardiac auscultation, the examiner notices something interesting.
What the examiner hears
- On expiration:
- On deep inspiration:
→ Single S2 sound
→ S2 splits into two components
This immediately raises a physiology-based question rather than pathology.
Step-by-step physiological explanation (connected without gaps)
1️⃣ Atrial timing: Right atrium contracts first
- The SA node is located in the right atrium
- Electrical activation spreads:
- Right atrium → left atrium (via Bachmann bundle)
- Therefore:
- Right atrial contraction precedes left atrial contraction slightly
📌 Clinically silent but foundational for understanding conduction timing.
2️⃣ Ventricular activation: LV contracts before RV
- Electrical activation passes through:
- AV node → His bundle → bundle branches
- Left ventricle has thicker myocardium
- LV pressure rises more rapidly
- Therefore:
- LV begins contraction slightly before RV
📌 Important exam trap:
LV contraction begins first — but ejection timing is different.
3️⃣ Why RV ejection starts earlier despite contracting later
This is the core concept students miss.
Pressure relationships:
Chamber | Outflow pressure |
Left ventricle → Aorta | High (≈80 mmHg diastolic) |
Right ventricle → Pulmonary artery | Low (≈10 mmHg diastolic) |
Consequence:
- RV needs less pressure to open pulmonary valve
- LV needs much higher pressure to open aortic valve
👉 So even though:
- LV contracts first
- RV ejection begins earlier
📌 This is purely pressure-dependent, not timing of contraction.
4️⃣ Valve closure sequence at rest
- Aortic valve closes → A2
- Pulmonary valve closes → P2
At rest:
- The gap between A2 and P2 is very narrow
- Often heard as a single S2
5️⃣ Effect of inspiration — the key clinical moment
When the patient takes a deep inspiration:
Changes occurring simultaneously:
A. Increased venous return to right heart
- Negative intrathoracic pressure
- More blood enters:
- Right atrium
- Right ventricle
B. Right ventricular systole lasts longer
- More blood → longer ejection
- Pulmonary valve closes later
→ P2 delayed
C. Reduced venous return to left heart
- Blood pools in pulmonary circulation
- LV fills slightly less
- LV ejects less blood
- Aortic valve closes slightly earlier
→ A2 earlier
6️⃣ Final audible result
- A2 occurs earlier
- P2 occurs later
➡️ Widened A2–P2 gap during inspiration
This is heard as:
Physiological splitting of S2
7️⃣ Examiner’s conclusion
- Young, healthy patient
- Inspiratory splitting of S2
- Disappears on expiration
👉 Normal physiological finding
8️⃣ One-line exam-perfect summary
Pulmonary valve closure is delayed during inspiration due to increased right ventricular filling, producing physiological splitting of S2.
9️⃣ Why this matters clinically
- Confirms normal cardiopulmonary interaction
- Helps differentiate:
- Physiological split (varies with respiration)
- From pathological splits (fixed, wide, paradoxical)
Final memory lock 🔒
- RA contracts first
- LV contracts first
- RV ejects first
- Inspiration delays P2
- A2 before P2 = normal
🔥 6. LENGTH OF SYSTOLE & DIASTOLE — Why HR affects filling
- As HR increases:
- Systole shortens slightly
- Diastole shortens A LOT (most important!)
Critical point:
Coronary perfusion of LV happens mainly in diastole.
At very high HR (~>180–200):
- Diastole becomes too short → poor filling → ↓ stroke volume → ↓ cardiac output.
Elaborative Clinical Scenario — Why Heart Rate Critically Affects Diastole, Filling & Coronary Perfusion
Clinical setting
A 26-year-old male is brought to the emergency department after collapsing during a high-intensity sprint.
He is anxious, sweaty, and tachypnoeic.
- Heart rate: 195 bpm
- Blood pressure: 80/50 mmHg
- Pulse: rapid, thready
- ECG: sinus tachycardia
- Chest pain: present
- Cold extremities, dizziness
Step 1: What happens to systole and diastole as HR rises?
As heart rate increases:
- Systole shortens slightly
- Diastole shortens disproportionately (this is the key)
Why?
- Systole has a minimum time requirement to generate pressure and eject blood
- Diastole is the flexible phase → it gets sacrificed first
So at very high HR (>180–200 bpm):
- Diastole becomes extremely brief
Step 2: Impact on ventricular filling (preload)
Normal physiology:
- ~70% of ventricular filling is passive and occurs during early diastole
- Atrial systole only contributes 20–30%
At very high HR:
- Diastole is too short
- Passive filling is severely reduced
- Atrial contraction has little time to add volume
Result:
- ↓ End-diastolic volume
- ↓ Preload
- ↓ Stroke volume (Frank–Starling mechanism fails)
So even though the heart is beating fast:
Fast heart ≠ good cardiac output
Step 3: Effect on cardiac output
Cardiac output = Heart rate × Stroke volume
At moderate HR rise:
- HR ↑
- SV maintained
- CO ↑ (normal exercise physiology)
At extreme HR:
- HR ↑↑
- SV ↓↓↓
- CO falls
This explains:
- Hypotension
- Dizziness
- Collapse
Step 4: Coronary perfusion — the most dangerous consequence
Critical physiological rule (exam gold):
Left ventricular coronary perfusion occurs mainly during diastole.
Why?
- During systole:
- LV myocardium contracts
- Intramyocardial vessels are compressed
- Coronary flow is minimal
- During diastole:
- Myocardium relaxes
- Coronary arteries fill
At very high HR:
- Diastole is too short
- Coronary perfusion drops sharply
- Myocardial oxygen demand is very high (tachycardia + sympathetic drive)
→ Supply–demand mismatch
Step 5: Clinical consequences in this patient
Because of extreme tachycardia:
- Poor ventricular filling
- ↓ Stroke volume
- ↓ Cardiac output
- Hypotension
- Reduced LV coronary perfusion
- Myocardial ischemia
- Chest pain
- ECG changes possible
- Vicious cycle
- Ischemia → ↓ contractility
- ↓ contractility → ↓ CO
- ↓ CO → reflex tachycardia → even shorter diastole
Step 6: Why slowing the heart rate helps (clinical management logic)
When HR is reduced (e.g., vagal maneuvers, beta-blockade in appropriate settings):
- Diastole lengthens
- Ventricular filling improves
- Stroke volume increases
- Coronary perfusion improves
- Cardiac output stabilizes
This is why:
- Rate control improves symptoms
- Excessive tachycardia is dangerous even in young hearts
One-line integrated exam answer
At very high heart rates, diastole shortens disproportionately, leading to reduced ventricular filling and impaired left ventricular coronary perfusion, resulting in decreased stroke volume, reduced cardiac output, and myocardial ischemia.
Final memory lock
- Systole shortens slightly
- Diastole shortens a lot
- Filling happens in diastole
- LV coronaries fill in diastole
- Extreme tachycardia = low CO + ischemia
🔥 BONUS: Electromechanical intervals (very high yield for SBAs)
- QS2: beginning of QRS → closure of aortic valve (S2).
- LVET: opening → closure of aortic valve (ejection time).
- PEP: QS2 – LVET (time before ejection starts).
- PEP/LVET increases when LV function is poor.
Exam sentence:
↑ PEP/LVET = ↓ LV performance.
🩺 Clinical Scenario: Acute LV Dysfunction Explained Through Electromechanical Intervals
A 64-year-old man with long-standing hypertension and ischemic heart disease presents to the emergency unit with:
- Progressive dyspnea on exertion
- Orthopnea and paroxysmal nocturnal dyspnea
- Fatigue and reduced exercise tolerance
On examination:
- Pulse: 96/min
- BP: 90/60 mmHg
- Bibasal lung crepitations
- Displaced, diffuse apex beat
- Soft S1, delayed S2
- Signs of left ventricular failure
An ECG, phonocardiogram, and echocardiography are performed to assess LV performance.
🫀 Step-by-Step Linking of Electromechanical Intervals
🔹 1. QS2 — Electrical Activation to Mechanical Completion
QS2 = beginning of QRS → aortic valve closure (S2)
- QRS marks onset of ventricular depolarization
- S2 marks end of mechanical systole
- Therefore, QS2 represents total electromechanical systole
📌 In this patient:
- LV contraction is weak and slow
- Ejection is prolonged and inefficient
- Aortic valve closes later
- → QS2 is prolonged
👉 Meaning:
The ventricle takes longer to complete systole due to impaired contractility.
🔹 2. LVET — Actual Blood Ejection Time
LVET = aortic valve opening → aortic valve closure
- This is the true ejection phase
- Depends on:
- Stroke volume
- Contractile strength
- Afterload
📌 In this patient:
- Weak LV → reduced stroke volume
- Cannot sustain high pressure
- Aortic valve closes early
- → LVET is shortened
👉 Meaning:
Less blood is ejected, and ejection ends prematurely.
🔹 3. PEP — Time Wasted Before Ejection Starts
PEP = QS2 − LVET
This includes:
- Electrical depolarization
- Isovolumetric contraction
- Time taken to build enough pressure to open aortic valve
📌 In this patient:
- LV is weak
- Takes longer to raise pressure
- Delayed aortic valve opening
- → PEP is prolonged
👉 Meaning:
More time is spent trying to eject, less time actually ejecting.
📊 The Critical Ratio: PEP / LVET
🔥 PEP/LVET = MOST SENSITIVE INDEX OF LV FUNCTION
In this patient:
- PEP ↑ (delayed pressure generation)
- LVET ↓ (shortened ejection)
- → PEP/LVET markedly increased
🧠 Integrated Pathophysiology (Why This Happens)
Weak LV →
↓ Rate of pressure rise (↓ dP/dt) →
Delayed aortic valve opening → PEP ↑
Weak sustained contraction →
Early aortic valve closure → LVET ↓
Result →
❗ High PEP/LVET = poor LV systolic performance
🧪 Clinical Correlation
This pattern is seen in:
- Acute myocardial infarction
- Dilated cardiomyopathy
- Severe systolic heart failure
- Cardiogenic shock
It correlates with:
- ↓ Ejection fraction
- ↓ Cardiac output
- Poor prognosis if persistent
📝 Exam-Perfect One-Liner
An increased PEP/LVET ratio indicates impaired left ventricular systolic function due to prolonged pre-ejection delay and shortened ejection time.
🎯 Final Concept Lock
- QS2 = total systole
- PEP = struggle before ejection
- LVET = actual useful work
- ↑ PEP / ↓ LVET = failing LV
🧠 One-line summary that makes everything make sense
The cycle is just filling → squeezing → relaxing, controlled by pressure differences and valve positions.
Heart faliure
🔥 1. TYPES OF HEART FAILURE — The single most important classification
A. Systolic Failure (HFrEF)
- Weak contraction → ↓ stroke volume.
- ↑ End-systolic volume → EF falls (65% → ~20%).
- Leads to ventricular dilation over time.
B. Diastolic Failure (HFpEF)
- Stiff ventricle → poor filling during diastole.
- EF remains normal, but stroke volume is low.
- Also leads to remodeling + fluid retention.
Exam sentence:
Systolic failure = reduced EF; Diastolic failure = preserved EF but impaired filling.
🩺 Elaborative Clinical Scenario: Two Patients, Same Symptoms — Different Failure
Emergency Admission: Breathlessness at Night
Two men arrive at the emergency unit with progressive exertional dyspnea, orthopnea, and ankle edema.
Both have basal crepitations, raised JVP, and bilateral pedal edema.
At first glance, they look identical.
But their cardiac physiology is completely different.
🔴 Patient A — Systolic Heart Failure (HFrEF)
History
- 58-year-old man
- Past anterior myocardial infarction
- Increasing fatigue, reduced exercise tolerance
What happened inside his heart? (Core mechanism)
- The left ventricle cannot contract effectively
- Myocardium is damaged and weak
- During systole:
- Less blood is ejected
- Stroke volume falls
- More blood remains in the ventricle after systole
👉 This causes:
- ↑ End-systolic volume
- Progressive ventricular dilation
- Worsening mechanical efficiency
Ejection Fraction logic (EXAM GOLD)
- Normal EF ≈ 65%
- His EF ≈ 20–30%
- Why?
- Stroke volume ↓
- End-diastolic volume ↑
- Fraction ejected is small
👉 This is systolic failure = reduced EF (HFrEF)
Downstream consequences
- ↓ Cardiac output → renal hypoperfusion
- Activates:
- RAAS
- Sympathetic system
- Leads to:
- Salt + water retention
- Pulmonary congestion
- Peripheral edema
- Chronic volume overload → remodeling + dilation
Clinical picture
- Enlarged, dilated LV
- Displaced apex beat
- S3 gallop
- Low pulse pressure
- Fatigue dominates
🔵 Patient B — Diastolic Heart Failure (HFpEF)
History
- 72-year-old man
- Long-standing hypertension
- Concentric LV hypertrophy
What happened inside his heart? (Core mechanism)
- The ventricle contracts well
- But it is stiff and non-compliant
- During diastole:
- Ventricular relaxation is impaired
- Filling is reduced
- End-diastolic volume is low
👉 This causes:
- ↓ Stroke volume
- ↑ Filling pressures
- Pulmonary congestion despite normal contraction
Ejection Fraction logic (VERY IMPORTANT)
- Stroke volume ↓
- End-diastolic volume ↓ proportionally
- Fraction ejected remains normal
👉 EF looks normal on echo
BUT:
- Absolute blood pumped per beat is low
👉 This is diastolic failure = preserved EF but impaired filling (HFpEF)
Downstream consequences
- Poor filling → ↑ left atrial pressure
- Pulmonary venous congestion
- RAAS activation due to perceived low output
- Fluid retention still occurs
- Structural remodeling continues (hypertrophy, fibrosis)
Clinical picture
- Normal-sized or thick-walled LV
- Often S4 gallop
- Hypertension common
- Symptoms worsen with:
- Tachycardia (less filling time)
- Loss of atrial kick (AF is disastrous)
⚖️ Why both patients look the same clinically
Both develop:
- Pulmonary congestion
- Peripheral edema
- Raised filling pressures
- Neurohormonal activation
- Progressive remodeling
But the primary failure point differs:
Feature | HFrEF | HFpEF |
Primary defect | Weak contraction | Poor relaxation |
Stroke volume | ↓ | ↓ |
EF | ↓ | Normal |
LV size | Dilated | Thick, stiff |
Typical cause | MI, cardiomyopathy | Hypertension, aging |
🧠 Final Examiner-Level Integration Sentence
In systolic heart failure, impaired ventricular contraction leads to reduced stroke volume, increased end-systolic volume, ventricular dilation, and reduced ejection fraction, whereas in diastolic heart failure, ventricular stiffness impairs filling so stroke volume is reduced despite preserved ejection fraction, with both conditions ultimately causing remodeling and fluid retention.
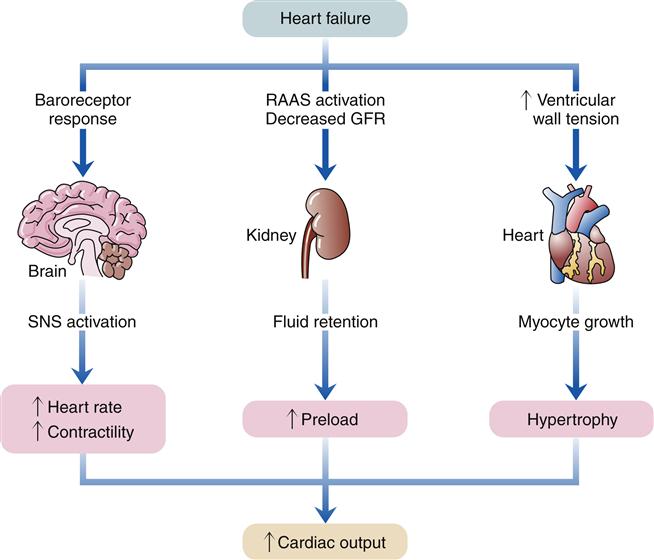
🔥 2. UNIVERSAL PATHOPHYSIOLOGY — The same for both types
Regardless of systolic vs diastolic:
When cardiac output drops → 3 compensatory systems activate:
- SNS activation → ↑ HR, ↑ contractility, vasoconstriction
- Renin–angiotensin–aldosterone system activation → Na⁺ & water retention
- Myocyte hypertrophy & remodeling → thickened walls → eventual dilation
👉 These early compensations become harmful long-term, worsening failure.
Elaborative Clinical Scenario — Universal Pathophysiology of Heart Failure
A 62-year-old man with long-standing hypertension and diabetes presents with progressive breathlessness, reduced exercise tolerance, and ankle swelling. Initially, he noticed only fatigue on exertion, but over months he developed orthopnea and wakes at night gasping for air.
Step 1: The Trigger — Falling Cardiac Output (common to HFrEF & HFpEF)
Regardless of whether the ventricle is weak (systolic failure) or stiff (diastolic failure):
- Effective cardiac output falls
- Tissues receive less oxygenated blood
- The body interprets this as circulatory underfilling
This single problem activates three powerful compensatory systems.
Step 2: Sympathetic Nervous System (SNS) Activation
Baroreceptors in the carotid sinus and aortic arch sense reduced pressure and trigger SNS outflow.
Immediate effects (initially helpful):
- ↑ Heart rate → maintains cardiac output
- ↑ Contractility → stronger ventricular squeeze
- Peripheral vasoconstriction → preserves BP to brain and heart
What the patient shows clinically:
- Tachycardia at rest
- Cold peripheries due to vasoconstriction
- Narrow pulse pressure early on
Long-term harm:
- Chronic tachycardia ↑ myocardial oxygen demand
- Persistent vasoconstriction ↑ afterload
- β-receptor down-regulation → reduced inotropic response
- ↑ risk of arrhythmias and sudden death
👉 What started as support becomes a burden on the failing heart.
Step 3: Renin–Angiotensin–Aldosterone System (RAAS) Activation
Reduced renal perfusion pressure is sensed by the juxtaglomerular apparatus.
Hormonal cascade:
- Renin → Angiotensin I → Angiotensin II
- Angiotensin II causes:
- Potent vasoconstriction
- ↑ Aldosterone → Na⁺ and water retention
- ↑ ADH → free water retention
Short-term benefit:
- ↑ Intravascular volume
- ↑ Preload → improves stroke volume via Frank–Starling mechanism
What the patient shows clinically:
- Peripheral edema
- Basal lung crepitations
- Raised JVP
- Weight gain from fluid retention
Long-term harm:
- Volume overload → pulmonary congestion
- Increased preload stretches ventricles excessively
- Angiotensin II promotes fibrosis and remodeling
👉 The kidney “helps” by retaining fluid—but drowns the lungs in the process.
Step 4: Myocyte Hypertrophy & Ventricular Remodeling
To cope with increased wall stress:
- Pressure overload → concentric hypertrophy (common in diastolic failure)
- Volume overload → eccentric hypertrophy and dilation (common in systolic failure)
Initial benefit:
- Thicker walls reduce wall stress (Laplace law)
- Maintains systolic pressure temporarily
Progressive damage:
- Hypertrophied myocardium becomes stiff
- Capillary density does not keep up → ischemia
- Fibrosis replaces contractile tissue
- Ventricular dilation distorts valve geometry → functional MR/TR
Clinical consequences:
- Worsening filling pressures
- Reduced stroke volume
- Falling ejection efficiency
- Transition from compensation → decompensated heart failure
👉 The heart remodels to survive—but remodels itself into failure.
Step 5: The Vicious Cycle
All three systems feed into each other:
- SNS ↑ RAAS
- RAAS ↑ remodeling
- Remodeling worsens pump function
- Pump failure further lowers cardiac output
This explains why the patient now presents with:
- Severe dyspnea
- Fluid overload
- Exercise intolerance
- Recurrent hospital admissions
One-Line Exam Integration
In both systolic and diastolic heart failure, reduced cardiac output activates SNS and RAAS, leading to hypertrophy and remodeling that initially compensate but ultimately worsen cardiac dysfunction.
This single pathophysiologic pathway explains all symptoms, signs, drug targets, and disease progression in heart failure.
🔥 3. HIGH-OUTPUT HEART FAILURE — Easy exam trick
Heart output is high, but still insufficient for tissue needs.
Seen in:
- Thyrotoxicosis
- Thiamine deficiency (beriberi)
- Large AV fistula
Exam sentence:
High-output failure = CO increased but demand even higher.
Elaborative Clinical Scenario — High-Output Heart Failure (Exam-Perfect Integration)
Clinical Story
A 42-year-old man presents with progressive shortness of breath, palpitations, fatigue, and bilateral ankle swelling for 3 months.
He reports heat intolerance, excessive sweating, weight loss despite good appetite, and tremors.
On examination:
- Pulse: 120/min, bounding
- Blood pressure: Wide pulse pressure
- Skin: Warm, flushed
- JVP: Elevated
- Cardiac exam: Hyperdynamic apex beat, flow murmurs
- Lungs: Basal crepitations
- Edema: Present
Key Question (Examiner’s Trap)
How can someone with a very strong, fast heart still be in heart failure?
Core Pathophysiology — The Heart Is Working Hard, But Losing
1️⃣ Cardiac Output Is HIGH
- Thyroid hormone causes:
- ↑ Heart rate
- ↑ Contractility
- ↑ Stroke volume
- So cardiac output is increased, not reduced.
👉 This immediately rules out classic low-output failure.
2️⃣ Systemic Demand Is EVEN HIGHER
Thyrotoxicosis causes:
- ↑ Basal metabolic rate
- ↑ Oxygen consumption
- ↑ Tissue nutrient demand
- ↓ Systemic vascular resistance (vasodilation)
➡️ Tissues demand more oxygen than even the high CO can supply.
Exam gold line:
Failure occurs because demand exceeds delivery.
3️⃣ Why Congestion Happens Despite High CO
- Chronic vasodilation → ↓ effective arterial filling
- Kidneys misinterpret this as hypovolemia
- RAAS activation → Na⁺ and water retention
- → Volume overload
- → Pulmonary congestion + peripheral edema
➡️ Same final pathway as low-output HF, but different starting point
Tie-In to Other Causes (Must Mention All)
A. Thiamine Deficiency (Beriberi)
- Thiamine required for carbohydrate metabolism
- Deficiency → ↓ ATP production
- Peripheral vasodilation + high metabolic demand
- Heart pumps harder → high CO
- Still fails due to unmet tissue demand
👉 Often seen in:
- Chronic alcoholism
- Malnutrition
- Post-bariatric surgery patients
B. Large AV Fistula
- Blood shunts directly from artery → vein
- Massive drop in SVR
- Heart increases output to maintain BP
- Chronic volume overload → HF symptoms
👉 Classic example:
- Dialysis AV fistula
- Traumatic AV fistula
Why This Is NOT Systolic or Diastolic Failure
Feature | High-Output HF |
Contractility | Normal / Increased |
EF | Normal or high |
SV | Increased |
CO | Increased |
Problem | Demand > supply |
Exam sentence:
High-output heart failure occurs despite normal ventricular function.
Final Exam-Ready Summary Sentence
High-output heart failure occurs when cardiac output is increased, but systemic metabolic demand or abnormal circulation exceeds the heart’s ability to supply tissues, leading to congestion and heart failure symptoms despite preserved ventricular function.
🔥 4. TREATMENT — The "Big 5" you MUST know
1. ACE inhibitors → MOST IMPORTANT treatment
- ↓ Angiotensin II
- ↓ Afterload
- ↓ Aldosterone
- ↓ Remodeling
- ↓ BP
2. ARBs (AT₁ blockers)
- Used if ACE inhibitors not tolerated.
3. Aldosterone antagonists (spironolactone, eplerenone)
- Prevent aldosterone effects (fluid retention + remodeling).
4. β-blockers
- ↓ mortality
- ↓ harmful SNS activation
- Essential therapy.
5. Diuretics
- Reduce symptoms by decreasing fluid overload.
Additional medications
- Nitrates / hydralazine → increase venous capacity → ↓ preload
- Digoxin → positive inotrope
- Used now mainly for systolic failure with AF to slow ventricular rate.
Exam sentence:
ACE inhibitors + β-blockers = foundational mortality-reducing treatment.Digoxin improves symptoms but does NOT reduce mortality.
🔥 5. The ONE line that summarizes heart failure
Heart failure is inadequate output due to weak contraction or impaired filling, with harmful neurohormonal activation that drives fluid retention and remodeling.
Elaborative Clinical Scenario — Integrating the “Big 5” Heart Failure Treatments
A 62-year-old man with a long history of hypertension and ischemic heart disease presents with progressive breathlessness, orthopnea, paroxysmal nocturnal dyspnea, and bilateral ankle swelling over several weeks. He reports reduced exercise tolerance and waking up at night gasping for air.
On examination, he is tachycardic, mildly hypotensive, with elevated JVP, basal lung crepitations, and pitting pedal edema. Cardiac exam reveals a displaced apex beat, consistent with ventricular dilation.
Echocardiography shows:
- Dilated left ventricle
- Reduced ejection fraction (≈30%)
- Features of systolic heart failure (HFrEF)
This patient’s symptoms and echo findings reflect neurohormonal activation (RAAS + sympathetic nervous system), which drives vasoconstriction, sodium and water retention, and adverse ventricular remodeling. The treatment strategy must therefore improve survival, prevent remodeling, and relieve congestion.
1️⃣ ACE Inhibitors — Foundation of Therapy (MOST IMPORTANT)
He is started on an ACE inhibitor (e.g., enalapril).
Pathophysiologic links:
- ↓ Angiotensin II → ↓ systemic vasoconstriction → ↓ afterload(the resistance the ventricle must overcome to eject blood during systole.)
- ↓ Aldosterone → ↓ sodium & water retention
- ↓ Ventricular remodeling (anti-fibrotic effect)
- ↓ Blood pressure and wall stress
Clinical effect:
Breathlessness improves over weeks, LV dilation progression slows, and mortality is reduced.
👉 If he developed ACE-inhibitor–induced cough or angioedema, therapy would be switched to an ARB (AT₁ blocker) with similar hemodynamic and prognostic benefits.
2️⃣ ARBs — When ACE Inhibitors Are Not Tolerated
If this patient cannot tolerate ACE inhibitors:
- ARBs block AT₁ receptors(Losartan)
- Prevent effects of angiotensin II (vasoconstriction, aldosterone release, remodeling)
👉 Same survival benefit, but without bradykinin-related cough.
3️⃣ Aldosterone Antagonists — Remodeling + Fluid Control
Despite ACE inhibition, aldosterone “escape” can occur. He is therefore started on spironolactone (or eplerenone).
Why this matters:
- Aldosterone causes myocardial fibrosis, ventricular remodeling, and fluid retention
- Blocking it:
- Reduces hospitalizations
- Reduces mortality
- Enhances diuretic response
Electrolytes are monitored closely due to risk of hyperkalemia.
4️⃣ β-Blockers — Essential Mortality-Reducing Therapy
Although he is initially tachycardic, a β-blocker (e.g., bisoprolol, carvedilol, or metoprolol) is introduced after stabilization.
Mechanistic integration:
- ↓ Chronic sympathetic overactivation
- ↓ Heart rate → ↓ myocardial oxygen demand
- ↓ Arrhythmias and sudden cardiac death
- Reverse β-receptor down-regulation
- Improve LV function over time
👉 This is counterintuitive but exam-critical:
β-blockers improve survival in chronic systolic HF, despite being negative inotropes.
5️⃣ Diuretics — Symptom Relief (NOT Mortality)
Because he has pulmonary congestion and edema, loop diuretics (e.g., furosemide) are given.
Clinical role:
- ↓ Intravascular volume
- ↓ Preload
- Rapid relief of:
- Dyspnea
- Orthopnea
- Peripheral edema
⚠️ Important exam distinction:
- Diuretics improve symptoms
- They do NOT reduce mortality
Additional Medications — Situation-Specific Use
Nitrates / Hydralazine
- Increase venous capacitance
- ↓ Preload
- Useful in:
- Persistent symptoms
- Patients intolerant to ACEi/ARB
- Specific populations with refractory HF
Digoxin — Special Role
Later, the patient develops atrial fibrillation with rapid ventricular response, worsening his symptoms.
Digoxin is added because:
- Positive inotrope → improves contractility
- Slows AV nodal conduction → controls ventricular rate in AF
Key exam principle:
- Digoxin improves symptoms
- Does NOT reduce mortality
- Best used in systolic HF + AF
Final Integrated Exam Take-Home
ACE inhibitors + β-blockers = core mortality-reducing therapy in systolic heart failure.Aldosterone antagonists further improve survival.
Diuretics and digoxin relieve symptoms but do NOT reduce mortality.
This single patient’s journey demonstrates how each drug class targets a specific pathophysiologic driver of heart failure—neurohormonal activation, remodeling, fluid overload, and arrhythmia—and why the “Big 5” must be used together, not in isolation.
🔥 1. ARTERIAL PULSE — What you must know
A. What creates the pulse?
- Pulse = pressure wave, NOT blood flow wave.
- The wave travels much faster than blood →
- Aorta: 4 m/s
- Large arteries: 8 m/s
- Small arteries: 16 m/s
- This is why you feel the radial pulse ~0.1 s after LV ejection.
Exam sentence:
Pulse = arterial wall expansion caused by a pressure wave, not the movement of blood itself.
B. What determines pulse strength?
- Pulse pressure (PP) determines how strong the pulse feels — NOT mean arterial pressure.
- Strong pulse → large stroke volume (exercise, histamine, aortic regurgitation).
- Weak/thready pulse → shock, low SV.
C. Aortic regurgitation pulse
- Very high PP → bounding pulse.
- Called water-hammer or Corrigan pulse.
- Can cause head bobbing (de Musset sign).
Exam sentence:
Aortic regurgitation → wide PP → collapsing pulse.
D. Dicrotic notch
- Small dip in the arterial trace caused by aortic valve closure.
- Visible on recordings, not palpable.
Elaborative Clinical Scenario — Arterial Pulse (All concepts integrated)
A 45-year-old man presents to the medical clinic with progressive breathlessness on exertion, awareness of his heartbeat, and occasional head nodding noticed by family members. He has a history of rheumatic fever in adolescence.
On examination, he is warm peripherally, with a visibly bounding carotid pulse. When you palpate the radial artery, the pulse rises rapidly and collapses quickly under your fingers.
What you are actually feeling (core physiology)
When the left ventricle ejects blood, it generates a pressure wave in the aorta.
This pressure wave:
- Causes arterial wall expansion
- Travels much faster than the blood itself
- Aorta ≈ 4 m/s
- Large arteries ≈ 8 m/s
- Small arteries ≈ 16 m/s
That is why, in this patient, you feel the radial pulse about 0.1 seconds after LV ejection, even though the blood itself has not yet reached the wrist.
👉 You are not feeling blood movement — you are feeling a pressure wave propagating along elastic arteries.
Why the pulse feels so strong
His pulse is forceful and bounding, not because of a high mean arterial pressure, but because of a very large pulse pressure (PP).
- Pulse pressure = systolic − diastolic pressure
- Pulse strength is determined by PP, not MAP
In this patient:
- Stroke volume is high → very high systolic pressure
- Diastolic pressure falls rapidly → blood leaks back into LV
Result → wide pulse pressure
This explains why the pulse feels strong, sharp, and collapsing.
Aortic regurgitation physiology brought to life
Echocardiography later confirms severe aortic regurgitation.
Pathophysiology:
- During systole → large stroke volume enters aorta → high systolic pressure
- During diastole → blood flows back into LV → low diastolic pressure
This produces:
- Wide pulse pressure
- Water-hammer (Corrigan) pulse
- Head bobbing with each heartbeat (de Musset sign) due to exaggerated arterial pulsations transmitted to the head and neck vessels
👉 This entire clinical picture is explained by pressure wave dynamics, not blood flow speed.
What you will NOT feel (but can see on a trace)
On arterial pressure waveform monitoring, a small dip appears after systolic ejection — the dicrotic notch.
- Caused by closure of the aortic valve
- Represents brief retrograde flow before elastic recoil
- Visible on arterial tracings
- Not palpable on clinical pulse examination
So although this patient has dramatic pulses, the dicrotic notch cannot be felt, only recorded.
Contrast for exam clarity
If this patient were in shock instead:
- Stroke volume would be low
- Pulse pressure would be narrow
- Pulse would feel weak and thready, even if heart rate were high
One integrated exam-ready summary
- Arterial pulse = pressure wave, not blood flow
- Pressure wave travels faster than blood → early peripheral pulse
- Pulse strength depends on pulse pressure, not MAP
- Aortic regurgitation → wide PP → bounding, collapsing pulse
- Dicrotic notch = aortic valve closure → seen on trace, not felt
This single patient ties all arterial pulse concepts into one coherent clinical picture without missing any physiology.
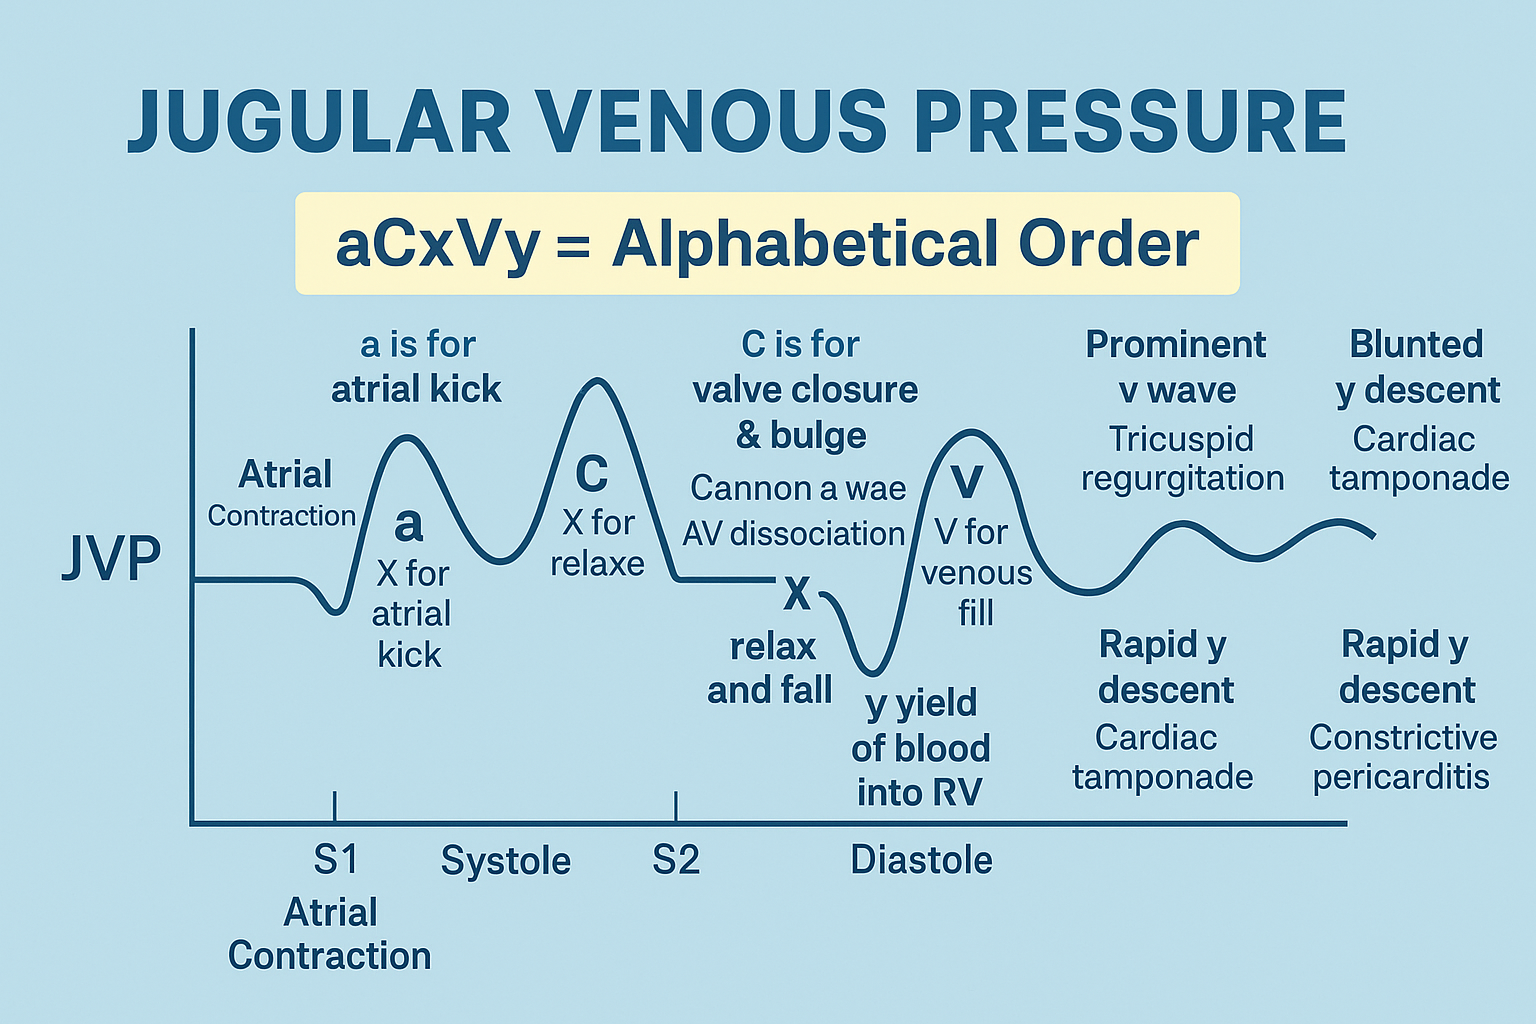
🔥 2. JUGULAR VENOUS PULSE (JVP) — The 3 waves you MUST know
These waves reflect right atrial pressure changes transmitted to the jugular vein.
1. a wave — Atrial systole
- Atria contract → pressure rises.
- Small backflow into veins + venous inflow stops → increases height.
Disappears in atrial fibrillation (VERY HIGH YIELD).
2. c wave — Bulging of tricuspid valve
- During isovolumetric ventricular contraction, the tricuspid valve bulges into the atrium.
- This increases RA pressure → creates the c wave.
3. v wave — Atrial filling during systole
- Valve closed → blood fills atrium → pressure rises.
- Peaks just before tricuspid valve opens.
Exam trick:
v = “venous return filling the atrium.”
Respiratory effects on JVP
- Inspiration → ↓ JVP (due to ↓ intrathoracic pressure).
- Expiration → ↑ JVP.
🔥 ONE SENTENCE THAT SUMS IT UP
The arterial pulse shows what the LV ejects (pressure wave), while the jugular venous pulse shows what the RA feels (pressure from atrial and valve motions).


Elaborative Clinical Scenario — JVP tied together clinically (nothing missed)
A 58-year-old man with long-standing hypertension presents with progressive ankle swelling, abdominal distension, and exertional dyspnea. On examination, he is propped up at 45°, and you inspect the right internal jugular vein.
What you see at the neck (JVP waveform explained in real time)
1️⃣ a wave — atrial systole (RIGHT ATRIUM CONTRACTING)
At first, you expect to see a normal a wave, caused by right atrial contraction pushing blood into the right ventricle, with a brief back-pressure transmitted to the jugular vein.
But in this patient:
- The rhythm is irregularly irregular
- No distinct a wave is visible
👉 This immediately tells you:
Atrial fibrillation is present, because:
- There is no coordinated atrial contraction
- Therefore, the a wave disappears (VERY HIGH-YIELD bedside finding)
This directly links:
- ECG rhythm abnormality
- Loss of atrial systole
- Absence of the a wave in JVP
2️⃣ c wave — tricuspid valve bulging (ISOVOLUMETRIC CONTRACTION)
As the right ventricle begins systole:
- The tricuspid valve closes
- During isovolumetric ventricular contraction, it bulges backward into the right atrium
- This transient rise in right atrial pressure produces the c wave
Clinically:
- The c wave is small and often difficult to see
- But it still reflects early ventricular systole, not atrial activity
👉 This links valve mechanics directly to the venous pulse.
3️⃣ v wave — atrial filling during ventricular systole
Now, while the tricuspid valve is closed:
- Venous blood continues returning to the heart
- The right atrium fills passively
- Pressure gradually rises → forming the v wave
- It peaks just before the tricuspid valve opens
Exam memory lock:
v = venous return filling the atrium
If this patient had tricuspid regurgitation, you would see:
- Massive v waves (blood leaking back into RA during systole)
But here, the v wave is moderately prominent, consistent with right-sided heart failure.
Respiratory variation — confirms venous origin
You now ask the patient to take a deep breath.
- Inspiration → JVP falls
- ↓ intrathoracic pressure
- ↑ venous return into the chest
- Blood drains from jugular veins
- Expiration → JVP rises
This respiratory behavior confirms:
- You are observing a venous pulse, not carotid arterial pulsation
Putting it all together — bedside integration
This single neck examination tells you:
- Absent a wave → atrial fibrillation
- c wave present → normal timing of ventricular systole
- Prominent v wave → raised right atrial pressure from congestion
- JVP falls on inspiration → normal venous physiology
Final unifying clinical sentence (exam-perfect)
The jugular venous pulse reflects right atrial pressure changes produced by atrial contraction (a wave), tricuspid valve motion during isovolumetric contraction (c wave), and atrial filling during ventricular systole (v wave), whereas the arterial pulse reflects left ventricular ejection as a pressure wave.
This is exactly why JVP is the window to the right heart, just as the arterial pulse is the window to the left ventricle.
🔥 1. HEART SOUNDS — The 4 sounds you MUST know
S1 (“lub”)
- Cause: Closure of AV valves (mitral + tricuspid).
- Timing: Start of ventricular systole.
- Quality: Low-pitched, 0.15 s.
- Soft S1 when ventricles are well filled (slow HR).
👉 Exam key: S1 = AV valve closure.
S2 (“dup”)
- Cause: Closure of aortic + pulmonary valves.
- Timing: End of ventricular systole.
- Higher pitched than S1.
- Loud S2 when aortic or pulmonary diastolic pressure is high.
Physiological splitting
- During inspiration → A2 before P2.
- Because pulmonary valve closes later at low pulmonary impedance.
👉 Exam key: S2 split widens on inspiration (normal).
S3 (third heart sound)
- Cause: Rapid ventricular filling → vibration of blood entering ventricle.
- Normal in young adults, athletes.
- Pathologic in older adults → heart failure (volume overload).
👉 Exam key: S3 = ↑ volume (dilated ventricle / HF).
S4 (fourth heart sound)
- Cause: Atrial contraction into a stiff ventricle (low compliance).
- Seen in ventricular hypertrophy, hypertension.
- Never normal in adults.
👉 Exam key: S4 = stiff ventricle (diastolic dysfunction).
Elaborative Clinical Scenario: “4 Sounds in 1 Patient Journey” (S1–S4 + S2 split, all connected)
Patient
A 62-year-old man with long-standing hypertension (poor control) comes to clinic with exertional dyspnea and fatigue. No fever. No chest trauma. No congenital history.
Scene 1 — You examine him at rest (bradycardic, well filled) → S1 concept
He’s calm, sitting. Pulse 56/min (slow). BP 170/95. JVP not high. No edema yet.
Auscultation (apex):
- You hear S1 (“lub”) at the start of systole.
- It sounds a bit softer than expected.
Why this happens (ties to your note):
- S1 = closure of AV valves (mitral + tricuspid) → marks start of ventricular systole.
- With a slow HR, there’s longer diastole → ventricles get well filled.
- When ventricles are already well filled and AV leaflets are relatively closer to closure position / less “snap,” the S1 can be softer (your “soft S1 when ventricles are well filled” point).
✅ Exam lock: S1 tells you AV valves shut → systole begins.
Scene 2 — You ask him to take deep breaths → S2 + physiological splitting
You now listen at the upper left sternal border while he takes slow deep breaths.
What you hear:
- On expiration, S2 sounds like one “dup.”
- On inspiration, it becomes two components: A2 then P2 (wider split).
Why this happens (exact link to your note):
- S2 = closure of aortic + pulmonary valves → marks end of ventricular systole.
- During inspiration, pulmonary vascular bed temporarily accommodates more blood (lower effective impedance), so RV ejection is slightly prolonged, so pulmonary valve closes later → P2 delayed.
- Therefore A2 comes before P2 and the split widens on inspiration → this is normal physiological splitting.
✅ Exam lock: Normal split = inspiration widens it; A2 before P2.
Scene 3 — His hypertension has caused LV hypertrophy → S4 appears
History reveals: years of headaches, poor meds, LVH on ECG previously. Echo (from last month) showed concentric LV hypertrophy.
Auscultation (apex, bell, left lateral position):
- Just before S1, you catch a low-frequency extra sound: S4.
Why this happens (your note, directly):
- S4 = atrial contraction into a stiff ventricle (low compliance).
- In LV hypertrophy / chronic hypertension, the ventricle is stiff → atrium must push harder at end-diastole → that atrial “kick” generates vibration → S4.
- In adults, S4 is not a normal finding → it signals diastolic dysfunction / reduced compliance.
✅ Exam lock: S4 = stiff ventricle (HTN/LVH) → “atrial kick sound.”
Scene 4 — Months later he decompensates into volume overload HF → S3 appears
Six months later, he comes to the ED: orthopnea, PND, swollen ankles. HR 110/min. Bibasal creps. Elevated JVP. Pitting edema.
Auscultation (apex):
- Right after S2, during early diastole, you hear a third sound: S3 (“lub-dup-ta”).
Why this happens (your note, directly):
- S3 = rapid ventricular filling causing vibration of blood entering the ventricle.
- In older adults, an S3 is typically pathologic, strongly pointing to heart failure/volume overload with a dilated ventricle.
- The ventricle is now handling too much volume, so early diastolic inflow produces that extra sound.
✅ Exam lock: S3 = increased volume, dilated ventricle, HF (pathologic in older adults).
Scene 5 — Bonus tie-in: loud S2 when diastolic pressure is high
On this decompensated visit, his BP is 190/100 and he has signs of high afterload. When you listen at the aortic area:
- S2 is loud, especially A2.
Why (your note):
- Loud S2 happens when aortic or pulmonary diastolic pressure is high → the semilunar valves close more forcefully.
✅ Exam lock: High diastolic pressure → louder semilunar closure → loud S2.
Final integrated interpretation (all 4 sounds in one storyline)
- S1: AV valves close → start systole; can be soft when well filled/slow HR.
- S2: semilunar valves close → end systole; physiological split widens on inspiration (A2 before P2); loud if diastolic pressure high.
- S4: atrial contraction into stiff LV → HTN/LVH/diastolic dysfunction (not normal in adults).
- S3: rapid filling into volume-overloaded/dilated ventricle → HF in older adults (normal only in young/athletes).
🔥 2. MURMURS — The cleanest high-yield summary
Murmur = turbulent flow.
Occurs when:
- Valve stenosis → narrowed opening → ↑ flow velocity
- Valve regurgitation → backward flow
- High flow states → anemia, fever, pregnancy, hyperthyroidism
Classic examples
- Aortic stenosis: Systolic crescendo–decrescendo.
- Aortic regurgitation: Diastolic, high pitched, “blowing,” water-hammer pulse, sometimes audible meters away.
- Interventricular septal defect: Holosystolic murmur (left → right shunt).
- Innocent murmurs in children: Soft systolic murmurs without disease.
👉 Timing rule:
- Systolic murmur = stenosis of semilunar valves (AS/PS) OR regurgitation of AV valves (MR/TR).
- Diastolic murmur = regurgitation of semilunar valves (AR/PR) OR stenosis of AV valves (MS/TS).
One sentence to memorize:
“Systole = AS / MR; Diastole = AR / MS.”
Elaborative Clinical Scenario — tying EVERY point together
The patient
A 42-year-old man presents to the medical clinic with progressive shortness of breath, easy fatigability, and palpitations. He also reports forceful heartbeats that he can feel in his neck and occasional head bobbing noticed by family members.
He has no chest pain, no syncope, and no past history of rheumatic fever. On examination, he looks mildly pale and warm.
Step 1 — Why a murmur exists (core principle)
On auscultation, you hear a murmur, which immediately tells you one thing:
Murmur = turbulent blood flow (NOT normal laminar flow).
Now you systematically think of the three mechanisms that can cause this turbulence:
- Valve stenosis → narrowed orifice → ↑ velocity
- Valve regurgitation → backward flow
- High-flow state → excessive volume moving through a normal valve
This patient is pale and warm → suggesting anemia, a classic high-flow state, which can exaggerate murmurs.
Step 2 — Timing is EVERYTHING
You carefully time the murmur with the carotid pulse.
You hear:
- A high-pitched, blowing murmur
- Best heard along the left sternal border
- Occurs immediately after S2 → early diastole
- The carotid pulse is bounding and collapsing
👉 This immediately places the murmur in diastole.
You now apply the timing rule:
- Diastolic murmur =
- Regurgitation of semilunar valves (AR / PR)
- OR stenosis of AV valves (MS / TS)
Given the blowing quality, early diastolic timing, and bounding pulse → this is aortic regurgitation.
Step 3 — Why aortic regurgitation sounds like this
In this patient:
- During diastole, the aortic valve should be closed
- Because it is incompetent:
- Blood leaks back from aorta → LV
- Creates turbulent backward flow
- Produces a high-pitched, blowing, diastolic murmur
The water-hammer pulse happens because:
- Systolic pressure rises (large stroke volume)
- Diastolic pressure falls (blood leaks back)
→ Wide pulse pressure
This perfectly explains:
- Bounding pulses
- Head bobbing
- Murmur sometimes audible from a distance
Step 4 — Contrast with another patient (aortic stenosis)
Later that day, a 68-year-old man presents with:
- Exertional dyspnea
- Angina
- Syncope
On auscultation:
- Systolic crescendo–decrescendo murmur
- Best heard in the aortic area
- Radiates to the carotids
Here, turbulence occurs because:
- The aortic valve is stenotic
- Blood must be forced through a narrow opening
- Velocity increases during systole
- Produces the classic ejection systolic murmur
👉 This is semilunar valve stenosis → systolic murmur
Step 5 — Holosystolic murmur example (VSD)
In the pediatric ward, a 5-year-old child is brought with:
- Poor weight gain
- Recurrent chest infections
Auscultation reveals:
- Harsh holosystolic murmur
- Heard best at the left lower sternal border
Why holosystolic?
- During entire systole, LV pressure > RV pressure
- Blood continuously shunts left → right
- Turbulence persists from S1 to S2
This is classic for an interventricular septal defect.
Step 6 — Innocent murmurs (high-flow without disease)
Finally, you examine a 7-year-old child:
- Asymptomatic
- Normal growth
- Normal ECG and echo
You hear:
- Soft systolic murmur
- No radiation
- Disappears on standing
This occurs because:
- Children have high cardiac output
- Thin chest walls
- Fast flow across normal valves
👉 High flow state → turbulence → murmur WITHOUT pathology
Final unbreakable logic (the examiner wants this)
- Systolic murmurs
- Semilunar stenosis → AS / PS
- AV regurgitation → MR / TR
- Diastolic murmurs
- Semilunar regurgitation → AR / PR
- AV stenosis → MS / TS
One-line memory lock
“Systole = AS / MR ; Diastole = AR / MS.”
This single rule lets you diagnose the valve lesion before echo, purely from timing + physiology.
🔥 4. ECHOCARDIOGRAPHY — Gold standard non-invasive valve assessment
- Uses ultrasound reflections to visualize:
- Doppler echo measures blood flow velocity and volume.
- Essential in:
- Valve stenosis (measures severity)
- Regurgitation (quantifies backward flow)
- Heart failure evaluation (EF measurement)
✓ Ventricular wall movement
✓ Chamber sizes
✓ Valve opening & closing
Exam key:
Echo + Doppler = best test for diagnosing and grading valvular disease.
🔥 ULTRA-HIGH-YIELD ONE-LINERS
- S1 = AV valves close.
- S2 = semilunar valves close.
- S3 = rapid filling (volume overload).
- S4 = atrial kick into stiff ventricle (hypertrophy).
- Systolic murmurs = AS or MR.
- Diastolic murmurs = AR or MS.
- Echo = #1 investigation for valve disease.
🔥 1. CARDIAC OUTPUT (CO) — Core Facts
- CO = Stroke Volume × Heart Rate
- Normal resting CO ≈ 5 L/min (70 mL × 72 bpm).
- Cardiac Index = CO per m² → Normal ≈ 3.2 L/min/m².
Exam sentence:
Normal cardiac output is 5 L/min and scales with body surface area.
🔥 2. MEASURING CARDIAC OUTPUT — The 3 methods you must know
A. Fick Principle (Gold standard physiology method)
Uses oxygen.
Formula:
CO = O₂ uptake / (Arterial O₂ – Venous O₂)
Example from textbook:
- O₂ consumption = 250 mL/min
- A–V difference = 50 mL O₂ per L blood
- CO = 250 / 50 = 5 L/min
Key idea:
The more oxygen tissues remove from blood, the lower the venous O₂ — allowing CO calculation.
B. Indicator Dilution Method
Inject a known indicator (dye or isotope) → measure how diluted it becomes in arterial blood.
Concept:
CO = (Amount injected) / (Average arterial concentration)
Important notes:
- Indicator must stay in blood and be harmless.
- Concentration curve is analyzed until the first pass of blood is complete.
C. Thermodilution (Very common in ICU)
- Inject cold saline into right atrium.
- Detect temperature change in pulmonary artery.
Key point:
More CO = colder saline diluted more quickly = smaller temperature change.
Advantages:
- Saline is harmless.
- Cold dissipates → no recirculation artifact → easy repeat measurements.
🔥 3. NORMAL CARDIAC OUTPUT & CONDITIONS THAT CHANGE IT
Baseline: 5 L/min (rest, supine)
Stroke volume: ~70 mL
🔥 4. CONDITIONS THAT INCREASE OR DECREASE CO (Very high yield)
↑ CO (increase)
- Exercise → can increase CO up to 7-fold (700%)
- Anxiety/excitement (50–100%)
- Eating (30%)
- Pregnancy
- High temperature
- Epinephrine
Exam sentence:
Exercise is the strongest physiologic augmenter of CO.
↓ CO (decrease)
- Standing up suddenly (20–30% drop initially)
- Rapid arrhythmias (↓ filling → ↓ stroke volume)
- Heart disease / failure
Exam sentence:
Anything that reduces ventricular filling reduces CO.
🔥 5. One line that summarizes everything
Cardiac output reflects how much blood the heart pumps per minute, measured by oxygen use (Fick), indicator dilution, or thermodilution, normally ~5 L/min, and varies strongly with exercise, posture, emotion, and disease.
🔥 1. The 3 Big Controllers of Cardiac Output (CO)
CO changes by altering:
- Heart rate (HR)
- Stroke volume (SV)
- Both together
This section explains exactly how.
🔥 2. AUTONOMIC NERVOUS SYSTEM — Main controller of HR & contractility
Sympathetic stimulation
- ↑ Heart rate (chronotropic effect)
- ↑ Contractility (inotropic effect)
- ↑ Ejection fraction (more blood pumped out)
Parasympathetic stimulation
- ↓ HR
- ↓ Contractility (mostly atria)
Exam sentence:
Sympathetic = faster + stronger; Parasympathetic = slower + weaker.
🔥 3. PRELOAD & AFTERLOAD — The two forces that determine stroke volume
Preload
- How much the myocardium is stretched before contraction.
- Directly proportional to end-diastolic volume (EDV).
- More stretch → stronger contraction → ↑ stroke volume.
Afterload
- The resistance against which the ventricle ejects blood.
- Equivalent to arterial pressure/systemic vascular resistance.
Exam sentence:
Preload = filling; Afterload = resistance.
Elaborative Clinical Scenario — Preload & Afterload (Nothing Missed)
Scenario
A 62-year-old man with long-standing hypertension and ischemic heart disease presents with acute breathlessness, orthopnea, and ankle edema. On examination:
- BP: 180/110 mmHg
- Pulse: 110/min
- Raised JVP
- Bilateral basal crepitations
- S3 gallop
- Chest X-ray: pulmonary congestion
- Echo: Dilated LV, reduced EF
Step-by-Step Physiology Inside This Patient
1️⃣ PRELOAD — What is happening here?
Definition in the patient
Preload = ventricular filling before contraction
→ represented by end-diastolic volume (EDV)
Why preload is HIGH in this patient
- Heart failure → poor forward flow
- Blood backs up into:
- Left atrium → pulmonary veins → lungs
- Systemic veins → raised JVP, edema
- Kidneys sense low effective circulation → RAAS activation
- Na⁺ + water retention
- ↑ venous return
- ↑ EDV
👉 Result: HIGH PRELOAD
Frank–Starling effect (important link)
- ↑ EDV → myocardial fibers stretch more
- Moderate stretch → stronger contraction
- This initially helps maintain stroke volume
👉 But here:
- LV is dilated + failing
- Fibers are overstretched
- Frank–Starling curve is flattened
📌 So increased preload now causes congestion, NOT effective output
2️⃣ AFTERLOAD — What is happening here?
Definition in the patient
Afterload = resistance the ventricle must overcome to eject blood
Practically:
- Equals arterial pressure + systemic vascular resistance
Why afterload is HIGH
- Long-standing hypertension
- High aortic pressure
- Vasoconstriction from:
- Sympathetic activation
- Angiotensin II
👉 LV must generate much higher pressure to open the aortic valve
Effect of high afterload on LV
- More time spent generating pressure
- Less blood ejected per beat
- ↑ End-systolic volume
- ↓ Stroke volume
- ↓ Cardiac output
📌 High afterload directly worsens systolic failure
3️⃣ Putting Preload + Afterload Together
Factor | In This Patient | Effect on Stroke Volume |
Preload | High | Initially helps, later causes congestion |
Afterload | Very high | Strongly ↓ stroke volume |
Net result | Failing pump | Pulmonary edema + low output |
👉 Even though the heart is full, it cannot eject effectively.
4️⃣ Why the Patient is Breathless
- High preload → pulmonary venous congestion
- Fluid leaks into alveoli
- ↓ Gas exchange
- Worse when lying flat → orthopnea
5️⃣ Why Treatment Targets Preload & Afterload
Diuretics
- ↓ Blood volume
- ↓ Venous return
- ↓ Preload
- Relieves pulmonary edema
ACE inhibitors / ARBs
- ↓ Angiotensin II
- Vasodilation
- ↓ Afterload
- Easier LV ejection
Nitrates
- Venodilation → ↓ preload
- Some arterial dilation → ↓ afterload
Result
- LV works on a better Frank–Starling curve
- ↑ Stroke volume
- ↓ Congestion
- ↑ Cardiac output
Final Exam-Perfect Integration Sentence
In heart failure, increased preload from fluid retention causes congestion, while increased afterload from hypertension and vasoconstriction impairs ventricular ejection; effective treatment improves stroke volume by reducing both preload and afterload.
🔥 4. FRANK–STARLING LAW — The heart’s automatic balancing system
“The energy of contraction is proportional to the initial length of the cardiac muscle fiber.”
This means:
- Greater EDV → greater stretch → greater force → increased stroke volume.
This creates the Frank–Starling curve:
More filling → more output (until an upper limit).
Why it matters clinically
- Ensures LV and RV pump equal volumes.
- Supports venous return changes (exercise, posture).
- Explains why too much preload eventually causes failure (dilation).
🔥 5. Heterometric vs Homometric Regulation (Simple explanation)
Heterometric regulation
- CO changes by changing fiber length (preload).
- Example: Frank–Starling mechanism.
Homometric regulation
- CO changes by changing contractility, not fiber length.
- Example: sympathetic stimulation ↑ inotropy without ↑ EDV.
Exam sentence:
Heterometric = length-dependent; Homometric = contractility-dependent.
🔥 6. One sentence that summarizes everything
Cardiac output is controlled by autonomic effects on HR and contractility, and by preload and afterload, with the Frank–Starling law linking filling (EDV) to stroke volume.
Elaborative clinical scenario — tying heterometric + homometric regulation together (nothing missed)
A 58-year-old man with long-standing hypertension presents to the emergency department with acute shortness of breath after missing his antihypertensive drugs for several days. He is anxious, tachycardic, mildly hypertensive, and has basal lung crepitations.
Step 1: What happens immediately (HETEROMETRIC regulation kicks in)
Because of fluid retention and raised venous pressures:
- Venous return increases
- End-diastolic volume (EDV) increases
- Ventricular muscle fibers are stretched more at end-diastole
This activates the Frank–Starling mechanism:
- Increased fiber length → more optimal actin–myosin overlap
- Stroke volume increases without any change in contractility
👉 This is heterometric regulation
✔ Length-dependent
✔ Preload-driven
✔ Automatic, intrinsic to the heart
Clinical meaning:
Even before any nerves or hormones act, the heart pumps harder simply because it fills more.
Step 2: The body senses trouble (HOMOMETRIC regulation activates)
The patient is breathless → baroreceptors sense stress → sympathetic nervous system is activated.
This causes:
- ↑ Heart rate
- ↑ Contractility (positive inotropy)
- No change in EDV is required for this effect
At the cellular level:
- ↑ Ca²⁺ entry during action potentials
- ↑ Ca²⁺ release from sarcoplasmic reticulum
- Each muscle fiber contracts more forcefully at the same length
👉 This is homometric regulation
✔ Length-independent
✔ Contractility-dependent
✔ Mediated by autonomic input
Clinical meaning:
The heart squeezes harder even if filling stays the same.
Step 3: How both mechanisms coexist in real life
In this patient both mechanisms operate simultaneously:
Mechanism | What changes | Purpose |
Heterometric | ↑ EDV → ↑ fiber length | Matches output to venous return |
Homometric | ↑ Contractility | Rapid response to stress |
- Frank–Starling handles volume changes
- Sympathetic stimulation handles acute demand
Neither mechanism alone is sufficient during stress — they complement each other.
Step 4: Why this matters clinically
If this patient had heart failure:
- Heterometric mechanism becomes blunted
- Heart relies more on homometric regulation
- Chronic sympathetic drive → remodeling, worsening failure
(Overstretched fibers → poor overlap)
This explains:
- Why diuretics help (↓ preload → optimize fiber length)
- Why β-blockers improve survival (protect myocardium from excessive homometric drive)
Final integrated exam-ready summary
- Heterometric regulation increases cardiac output by increasing fiber length via preload (Frank–Starling).
- Homometric regulation increases cardiac output by increasing contractility at the same fiber length (sympathetic stimulation).
- In real patients, both act together to maintain cardiac output during rest, exercise, and stress.
One perfect closing line (tie-in)
Cardiac output is controlled by preload-dependent fiber length changes (heterometric regulation) and autonomic modulation of heart rate and contractility (homometric regulation), with the Frank–Starling law ensuring moment-to-moment matching of output to venous return.
Feature | Heterometric | Homometric | |
Primary change | Fiber length | Contractility | |
EDV | ↑ | Same | |
ESV | Same | ↓ | |
Stroke volume | ↑ | ↑ | |
ESPVR | Same | Shifts up/left | |
Example | IV fluids, venous return | Sympathetic drive, adrenaline |
end-diastolic volume (EDV) and myocardial contractility
🔥 1. END-DIASTOLIC VOLUME (EDV) — What determines how much the ventricle fills
EDV depends on:
- Ventricular compliance (stiffness)
- Pericardial pressure
- Atrial contraction
- Venous return
These 4 points = 95% of exam questions.
🔥 A. What REDUCES EDV (↓ filling)?
1. ↑ Intrapericardial pressure
- Pericardial effusion
- Tumor
- Infection
→ Heart cannot expand → ↓ filling → ↓ EDV
2. ↓ Ventricular compliance (stiffer ventricle)
Caused by:
- Myocardial infarction
- Hypertrophy
- Infiltrative diseases (amyloidosis)
Result: Stiff ventricle → cannot fill → diastolic dysfunction.
3. ↓ Intrathoracic negative pressure
- Positive pressure ventilation
- Valsalva
→ Less suction of venous blood → ↓ venous return → ↓ EDV
4. Standing up
Blood pools in legs → ↓ venous return → ↓ EDV
🔥 B. What INCREASES EDV (↑ filling)?
1. ↑ Total blood volume
- IV fluids
- Pregnancy
- Renin–angiotensin activation
2. Venoconstriction
Sympathetic activity squeezes venous reservoirs →
→ More blood returns to heart → ↑ EDV
3. Muscle pump
Walking, leg movements → push venous blood upward → ↑ venous return
4. Atrial contraction (atrial systole)
Boosts filling — extremely important when ventricles are stiff (HFpEF).
Exam sentence:
Anything that increases venous return increases EDV; anything that restricts expansion of the ventricle decreases EDV.
🔗 Integrated Clinical Scenario — EDV in Real Life (Nothing Missed)
The patient
A 68-year-old man with long-standing hypertension and ischemic heart disease is admitted with acute shortness of breath. He is obese, recently had an anterior MI, and is now in the ICU.
🧠 What’s happening to his EDV — step by step
🔻 1. Ventricular compliance is reduced (major hit to EDV)
- Years of hypertension → concentric LV hypertrophy
- Recent myocardial infarction → stiff, non-compliant myocardium
- Result:
- Ventricle cannot relax properly
- Even small volumes cause high diastolic pressure
- ↓ EDV despite normal blood volume
👉 This is diastolic dysfunction (HFpEF).
🔻 2. Intrapericardial pressure rises
During ICU stay, he develops:
- Pericardial effusion (post-MI inflammatory process)
Effect:
- Pericardium acts like a rigid box
- Heart cannot expand outward
- ↓ ventricular filling → ↓ EDV
👉 Same physiology as cardiac tamponade (early stage).
🔻 3. Intrathoracic pressure becomes positive
He is put on positive-pressure ventilation due to pulmonary edema.
Effect:
- Normal inspiration = negative pressure → pulls venous blood into chest
- Positive pressure ventilation:
- Removes venous “suction”
- ↓ venous return
- ↓ EDV
🔻 4. He stands up suddenly during recovery
On mobilization:
- Blood pools in leg veins
- Venous return temporarily falls
- ↓ EDV → dizziness
👉 Classic postural reduction in preload.
🔺 Now flip the scenario — what increases his EDV
🔺 5. IV fluids are started carefully
- ↑ Total blood volume
- ↑ Venous return
- ↑ EDV (but risky in stiff ventricle → pulmonary edema)
🔺 6. Sympathetic activation (stress, hypotension)
- Venoconstriction squeezes venous reservoirs (legs, splanchnic bed)
- More blood returns to heart
- ↑ EDV
🔺 7. Muscle pump during walking
- Calf muscles compress veins
- Venous valves direct blood upward
- ↑ venous return → ↑ EDV
This is why walking improves orthostatic symptoms.
🔺 8. Atrial contraction becomes CRITICAL
Because the ventricle is stiff:
- Passive filling is poor
- Atrial systole (“atrial kick”) becomes essential
Now imagine:
- He develops atrial fibrillation
- Loses atrial contraction
Result:
- Sudden drop in EDV
- Acute pulmonary edema + hypotension
👉 This is why AF is poorly tolerated in HFpEF.
🧩 Everything tied together (exam-ready logic)
- EDV = how much blood the ventricle can accept
- It depends on:
- Compliance (stiff vs flexible ventricle)
- External constraint (pericardial pressure)
- Venous return (blood volume, venous tone, posture, respiration)
- Atrial contraction (especially in stiff ventricles)
🏁 One killer exam sentence
Anything that increases venous return or atrial contribution increases EDV; anything that stiffens the ventricle or restricts its expansion decreases EDV.
🔥 2. MYOCARDIAL CONTRACTILITY — How strong the heart squeezes (independent of EDV)
This is the key determinant of stroke volume besides preload.
🔥 A. What INCREASES CONTRACTILITY (positive inotropes)?
1. Sympathetic stimulation (β1)
- Norepinephrine release
- Epinephrine
→ ↑ cAMP → ↑ Ca²⁺ inside cells → stronger contraction
2. Drugs that ↑ cAMP
- Caffeine, theophylline → inhibit cAMP breakdown
3. Digitalis (digoxin)
- Inhibits Na⁺/K⁺ ATPase
- ↓ Ca²⁺ extrusion → ↑ intracellular Ca²⁺
→ Powerful positive inotrope
4. Force–frequency relation
- Faster heart rate → slightly ↑ contractility (Bowditch effect)
5. Post-extrasystolic potentiation
- Extra beat → next beat is stronger
- Due to ↑ Ca²⁺ availability
🔥 B. What DECREASES CONTRACTILITY (negative inotropes)?
- Hypoxia
- Acidosis
- Hypercapnia (↑ CO₂)
- Antiarrhythmics: quinidine, procainamide
- Barbiturates
- Heart failure itself (β-receptor down-regulation + impaired calcium handling)
Exam sentence:
Contractility increases with sympathetic input and calcium availability, but decreases with hypoxia, acidosis, and myocardial disease.
🔥 3. Starling vs Contractility (KNOW THIS!)
- Starling mechanism (preload-dependent) → “heterometric regulation”
- Contractility (preload-independent) → “homometric regulation”
Exam sentence:
More preload = stronger contraction (Starling); more Ca²⁺ = stronger contraction (inotropy).
🔥 4. One-line ultra-summary
EDV is determined by filling conditions (venous return, compliance, pericardium), while contractility is determined by calcium availability and sympathetic tone.
Integrated Clinical Scenario — Myocardial Contractility in Real Life (Nothing Missed)
The patient
A 62-year-old man with long-standing hypertension and ischemic heart disease is admitted with acute pulmonary edema. He is dyspneic at rest, tachycardic, hypotensive, and hypoxic. Bibasal crepitations are present. ECG shows sinus tachycardia with occasional ventricular ectopics. Echocardiography reveals dilated LV with reduced EF (25%).
🧠 Step 1: What is going wrong at the myocardial level?
This patient’s stroke volume is low, not because of poor filling alone, but because myocardial contractility is impaired.
Key point:
Contractility = intrinsic strength of contraction, independent of EDV.
In him:
- Heart failure itself →
- β₁-receptor down-regulation
- Impaired calcium handling
→ ↓ contractility
So even if EDV increases, the heart cannot generate adequate force.
⚠️ Step 2: Factors that are actively DECREASING his contractility
1. Hypoxia
- Pulmonary edema → poor oxygen diffusion
- ↓ ATP production → ↓ Ca²⁺ cycling efficiency
→ Weaker contraction
2. Acidosis
- Tissue hypoperfusion → lactic acidosis
- H⁺ interferes with actin–myosin interaction
→ ↓ force generation
3. Hypercapnia
- CO₂ retention due to respiratory failure
- Further worsens intracellular acidosis
→ ↓ inotropy
4. Myocardial disease
- Ischemic cardiomyopathy
- Loss of functional myocytes
→ ↓ contractile units
👉 All four negative inotropes are present simultaneously.
🚑 Step 3: Immediate management — How we INCREASE contractility
A. Sympathetic stimulation (β₁)
Because BP is low, he is started on IV dobutamine.
Mechanism:
- β₁ stimulation → ↑ cAMP
- ↑ Ca²⁺ influx via L-type channels
→ Stronger systolic contraction
Clinical effect:
- ↑ Stroke volume
- ↑ Cardiac output
- ↓ Pulmonary congestion
B. Digoxin (later, once stabilized)
He also has intermittent atrial fibrillation with rapid ventricular response.
Digoxin is added.
Mechanism (exam gold):
- Inhibits Na⁺/K⁺-ATPase
- ↓ Na⁺ extrusion → ↓ Ca²⁺ extrusion via Na⁺/Ca²⁺ exchanger
→ ↑ intracellular Ca²⁺
→ Powerful positive inotropy
Bonus:
- Slows AV conduction → controls ventricular rate in AF
C. Force–frequency relation (Bowditch effect)
Initially, his HR rises due to sympathetic drive.
- Moderate ↑ HR → slight ↑ contractility
- Due to increased Ca²⁺ availability per unit time
⚠️ But:
- Excessive tachycardia → ↓ diastolic time → ↓ coronary perfusion
→ Net worsening if HR too high
D. Post-extrasystolic potentiation (seen on monitor)
He has occasional ventricular premature beats.
Observation:
- After a PVC → the next beat is stronger
Why?
- Extra beat → extra Ca²⁺ remains in SR
- Next beat releases more Ca²⁺
→ Transient increase in contractility
This is a classic bedside demonstration of calcium-dependent inotropy.
🧠 Step 4: Starling vs Contractility — applied to this patient
Starling mechanism (heterometric regulation)
- ↑ Venous return → ↑ EDV → stronger contraction
- Depends on fiber stretch
In this patient:
- LV is already dilated
- Further preload increase → pulmonary edema
→ Starling is exhausted
Contractility (homometric regulation)
- Independent of EDV
- Depends on Ca²⁺ availability + sympathetic tone
This is why:
- Inotropes work even without increasing preload
- Digoxin and β₁ agonists improve output despite fixed EDV
🧠 One-sentence clinical integration (EXAM-PERFECT)
In heart failure, stroke volume falls not only due to impaired filling but mainly due to reduced myocardial contractility from β-receptor down-regulation, impaired calcium handling, hypoxia, acidosis, and hypercapnia—hence treatment focuses on improving calcium availability and sympathetic inotropy rather than increasing preload.
🔥 Ultra-summary lock
- EDV → filling conditions
- Contractility → Ca²⁺ + β₁ tone
- Starling = preload-dependent
- Inotropy = preload-independent
- Heart failure = failure of both, but contractility is the killer
If you want, I can next:
- Tie this into pressure–volume loops, or
- Convert this into a single SBA-style exam vignette with options, or
- Link it to PEP/LVET changes in poor contractility.
control of cardiac output + myocardial oxygen consumption.
🔥 1. How Cardiac Output Increases During Exercise (Integrated Control)
Exercise triggers three major mechanisms:
1. Sympathetic activation → ↑ HR + ↑ contractility
- HR increases dramatically (main driver of ↑ CO in normal people).
- Stroke volume increases modestly.
Exam key:
HR is the dominant contributor to increased CO during exercise.
2. Frank–Starling mechanism (↑ filling → ↑ output)
- Muscle pump + increased breathing → ↑ venous return.
- ↑ EDV → stronger contraction → ↑ SV.
Even heart transplant patients, with no cardiac nerves, can increase CO using:
- Frank–Starling mechanism
- Circulating catecholamines
Exam key:
Transplanted heart increases CO mainly via Frank–Starling, not nerves.
3. ↓ Afterload (due to vasodilation in working muscles)
- Exercising muscles vasodilate → ↓ peripheral resistance → ↓ afterload
- Easier for the heart to eject blood → ↑ SV & ↑ CO
Elaborative Integrated Clinical Scenario — Exercise Physiology in Action
Clinical setting
A 28-year-old healthy male begins a graded treadmill exercise test as part of a routine fitness assessment. At rest, his vitals are normal. As the treadmill speed and incline increase, several simultaneous cardiovascular adjustments occur to meet the rising metabolic demand of skeletal muscles.
Phase 1: Immediate response (first seconds of exercise)
As soon as exercise starts, central command from the motor cortex activates the sympathetic nervous system and withdraws vagal tone.
What happens physiologically:
- Heart rate rises rapidly
- This is the earliest and most powerful contributor to increased cardiac output.
- Myocardial contractility increases
- β₁-adrenergic stimulation → stronger ventricular contraction.
- Stroke volume increases modestly
- Compared to HR, SV contributes less in healthy individuals.
Clinical integration:
- Cardiac output = HR × SV
- Because HR can double or triple, while SV rises only modestly, HR is the dominant driver of increased CO during exercise.
Exam lock:
In normal individuals, increased cardiac output during exercise is driven primarily by heart rate, not stroke volume.
Phase 2: Sustained exercise (minutes into exercise)
As exercise continues, peripheral mechanisms become increasingly important.
Frank–Starling mechanism comes into play
Peripheral changes:
- Skeletal muscle pump
- Rhythmic muscle contraction compresses veins → pushes blood back to the heart.
- Respiratory pump
- Deeper and faster breathing → ↓ intrathoracic pressure → ↑ venous return.
Cardiac effect:
- ↑ Venous return → ↑ end-diastolic volume (EDV)
- Myocardial fibers stretch more → stronger contraction
- → ↑ stroke volume via Frank–Starling mechanism
Clinical relevance:
Even if cardiac autonomic nerves are absent, this mechanism still works.
Special comparison: Heart transplant patient
Now consider a heart-transplant recipient performing the same treadmill test.
- The transplanted heart has no autonomic innervation.
- Early exercise:
- HR does not rise immediately.
- Cardiac output still increases because of:
- ↑ Venous return → Frank–Starling mechanism
- Later contribution from circulating catecholamines (adrenal adrenaline)
Exam lock:
In heart-transplant patients, increased cardiac output during exercise occurs mainly via the Frank–Starling mechanism, not neural stimulation.
Phase 3: Vascular adjustments — Afterload reduction
As working muscles demand more oxygen:
Peripheral vascular changes:
- Local metabolites (CO₂, H⁺, adenosine, lactate, heat) cause vasodilation in active skeletal muscles.
- This leads to:
- ↓ Total peripheral resistance
- ↓ Afterload on the left ventricle
Cardiac benefit:
- Reduced afterload → ventricle ejects blood more easily
- → Further ↑ stroke volume
- → Supports sustained rise in cardiac output without excessive pressure rise
Integrated final picture
During exercise, cardiac output increases through three coordinated mechanisms acting together:
- Sympathetic activation
- ↑ HR (main driver)
- ↑ Contractility
- Frank–Starling mechanism
- ↑ Venous return → ↑ EDV → ↑ SV
- Dominant in denervated (transplanted) hearts
- Reduced afterload
- Muscle vasodilation → ↓ peripheral resistance → easier ejection
One-line exam summary
During exercise, cardiac output rises mainly due to increased heart rate, supported by enhanced venous return via the Frank–Starling mechanism and reduced afterload from skeletal muscle vasodilation.
🔥 2. Trained Athletes vs Untrained Individuals
Athletes at rest have:
- Lower HR
- Higher end-systolic volume
- Higher stroke volume
Therefore:
- They increase CO in exercise mainly by increasing stroke volume
- Not by drastically increasing HR.
Exam key:
Athletes rely more on stroke volume; untrained people rely more on heart rate.
🔥 3. MYOCARDIAL OXYGEN CONSUMPTION (Very high yield)
Normal values
- Basal (non-beating): 2 mL O₂ / 100 g / min
- Resting beating heart: 9 mL O₂ / 100 g / min
The heart extracts O₂ almost maximally at rest, so to increase O₂ supply:
→ Coronary blood flow MUST increase.
Exam key:
Cardiac O₂ extraction is already near-maximal → increased demand requires increased coronary flow.
🔥 4. What Determines Myocardial O₂ Consumption? (The Big 3)
1. Intramyocardial wall tension
(Largest determinant)
- Wall tension = governed by Laplace’s law → tension ∝ radius.
- Larger ventricle → ↑ radius → ↑ O₂ demand.
2. Contractility
- Stronger contractions → ↑ O₂ consumption.
3. Heart rate
- More beats/minute → more energy needed.
Exam one-liner:
O₂ consumption increases with wall tension, contractility, and heart rate.
🔥 5. Pressure work vs Volume work (Gold concept!)
- Pressure work (increased afterload) → much higher O₂ consumption
- Volume work (increased preload) → less O₂ demand
This explains:
- Aortic stenosis → angina more common
- Aortic regurgitation → less angina
(LV must generate very high pressure → ↑↑ O₂ demand)
(LV increases volume, not pressure)
Exam key:
Pressure overload increases O₂ consumption more than volume overload.
🔥 6. Why heart rate increases O₂ demand but also reduces wall tension
- Sympathetic stimulation → ↑ HR + ↑ contractility → ↑ O₂ demand
- But ↓ end-systolic volume → ↓ radius → slightly offsets O₂ cost
🔥 ONE-LINE MASTER SUMMARY
Exercise increases cardiac output via ↑ HR, ↑ contractility, ↓ afterload, and ↑ venous return; myocardial oxygen consumption depends mainly on wall tension, contractility, and heart rate, with pressure work demanding far more O₂ than volume work.
🔥 PART 1 — SHOCK (Clinical Box 30-2)
One universal definition:
Shock = inadequate tissue perfusion due to inadequate cardiac output (absolute or relative).
1. The 4 Types of Shock (Very high yield)
A. Hypovolemic (“cold”) shock
- ↓ blood volume → ↓ venous return → ↓ CO
- Causes: bleeding, dehydration, burns (plasma loss)
- Features: cold clammy skin, tachycardia, ↓ pulse pressure, lactic acidosis
- Late stage: bradycardia before terminal tachycardia
B. Distributive (vasogenic) shock
- Massive vasodilation → vascular space ↑ → relative hypovolemia
- Includes septic shock, anaphylaxis, neurogenic shock
- Skin may be warm early in sepsis
C. Cardiogenic shock
- Pump failure (MI, severe arrhythmia, myocarditis)
- High filling pressures but low output
- Skin cold, cyanotic
D. Obstructive shock
- Mechanical obstruction to flow
(PE, cardiac tamponade, tension pneumothorax)
2. Key physiology in hemorrhagic shock
- ↓ volume → ↓ venous return → ↓ CO
- Baroreceptor firing ↓ → ↑ sympathetic output
- Reflex tachycardia + vasoconstriction
- Severe blood loss → anaerobic glycolysis → ↑ lactate (up to 9 mmol/L) → lactic acidosis
- Skin becomes cold, pale, gray, due to vasoconstriction
- Kidneys: ↑ filtration fraction, marked Na⁺ retention, risk of acute kidney injury
- Blood volume restored over 12–72 hours, RBC mass restored in 4–8 weeks
Exam sentence:
In hypovolemic shock, pulse pressure falls before mean arterial pressure falls.
3. Treatment Highlights (Very high yield)
- Fix the cause
- Hemorrhage → early, rapid blood transfusion
- Burns / plasma loss → plasma or albumin
- Hypertonic solutions → rapid expansion but risk of tissue dehydration
- Goal: restore perfusion pressure + volume
🔥 PART 2 — CIRCULATORY CHANGES DURING EXERCISE (Clinical Box 30-3)
1. Why exercising muscle gets enormous blood flow
During rhythmic contraction:
- Local vasodilators ↑ (↓PO₂, ↑PCO₂, ↑K⁺, heat)
- Arterioles + precapillary sphincters dilate → 10–100× more open capillaries
→ ↑ O₂ delivery + ↓ diffusion distance
Exam key:
Rhythmic muscle contraction can increase muscle blood flow up to 30-fold.
🔥 2. Isometric vs Isotonic Exercise (EXTREMELY HIGH YIELD)
A. Isometric exercise (static holding, e.g., planks)
- Muscle stays contracted → compresses vessels → ↓ muscle blood flow
- ↑ HR (psychogenic, ↓ vagal tone)
- Sharp ↑ systolic & diastolic BP
- Stroke volume changes little
- Total peripheral resistance (TPR) ↑
B. Isotonic exercise (running, cycling)
- Repetitive contraction → muscle relaxation periods → massive vasodilation
- ↑ HR + marked ↑ stroke volume
- TPR falls
- Systolic BP ↑ moderately, diastolic stays same or ↓
- CO may exceed 35 L/min in athletes
Exam sentence:
Isometric → ↑ BP↑ TPR; Isotonic → ↑ CO, ↓ TPR.
🔥 3. Athletes vs Untrained Individuals
- Athletes have:
- Larger hearts
- Higher SV
- Lower resting HR
- Higher maximal VO₂ (VO₂max)
- VO₂max = max CO × max O₂ extraction
Typical VO₂max:
- Men: 38 mL/kg/min
- Women: 29 mL/kg/min
🔥 4. Venous Return During Exercise
Increases via:
- Muscle pump
- Thoracic pump
- Venoconstriction (sympathetic)
- Mobilization of blood from splanchnic reservoirs
Up to 30% more blood can shift into arterial circulation during strenuous exercise.
🔥 ONE-LINE MASTER SUMMARY
Shock is inadequate perfusion from low volume, vasodilation, pump failure, or obstruction, while exercise massively increases CO through sympathetic activation, muscle vascular dilation, and increased venous return—with different BP responses in isometric vs isotonic activity.